Gallery of Student Work
2024 Senior Documentary:
The Roots of Change
Through the lens of formerly incarcerated individuals finding a path forward in green reentry programs, The Roots of Change illuminates the interrelationship of social justice, environmental activism, and economic opportunity. It weaves together narratives of redemption, resilience, and community empowerment to highlight the ways intersectional programs can produce systemic change.
Beneath The Roots:
Making The Roots of Change
Students share a glimpse behind the scenes of their experiences making the 2024 Four Rivers senior documentary “The Roots of Change.”
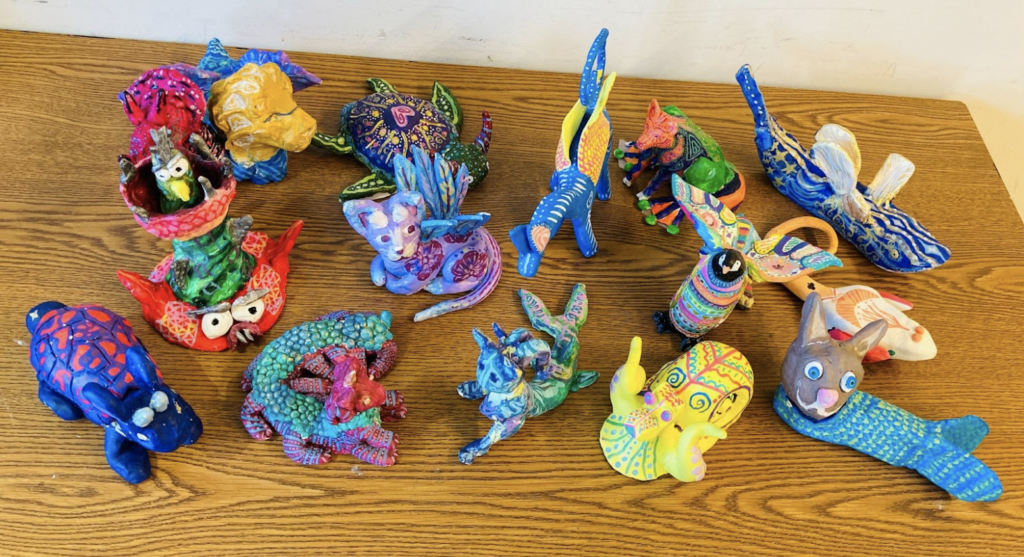
Alebrijes
Advanced Spanish students have been working to complete these wonderful Alebrijes (spirit animals) a Mexican folk art that will inspire them to create fairy tales completely in Spanish. Then, they will share these folktales with students at a local elementary school.
10th Grade Mind Maps
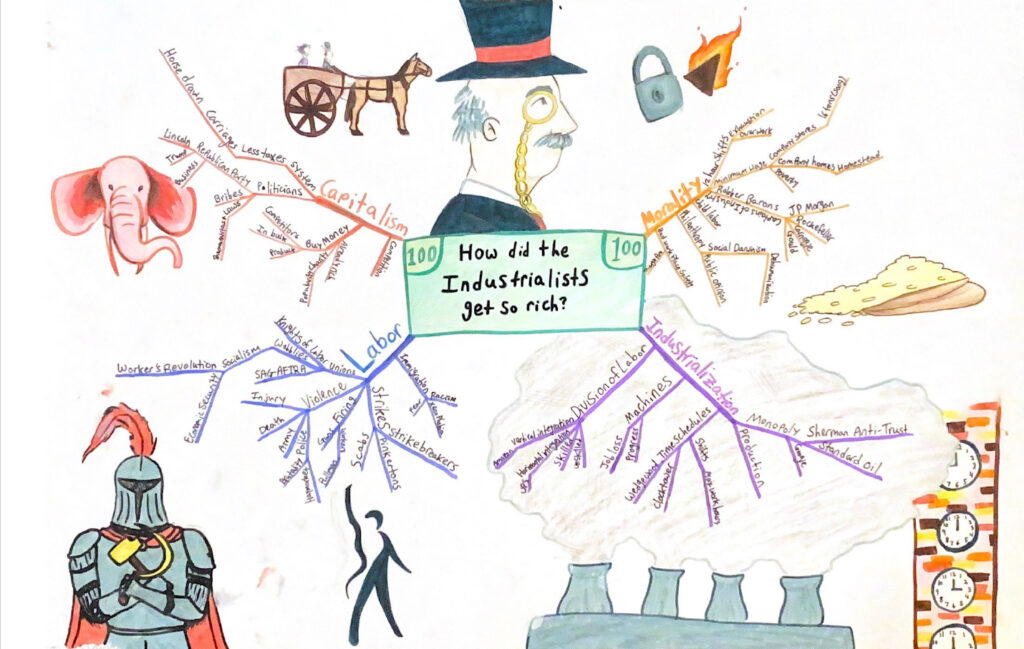
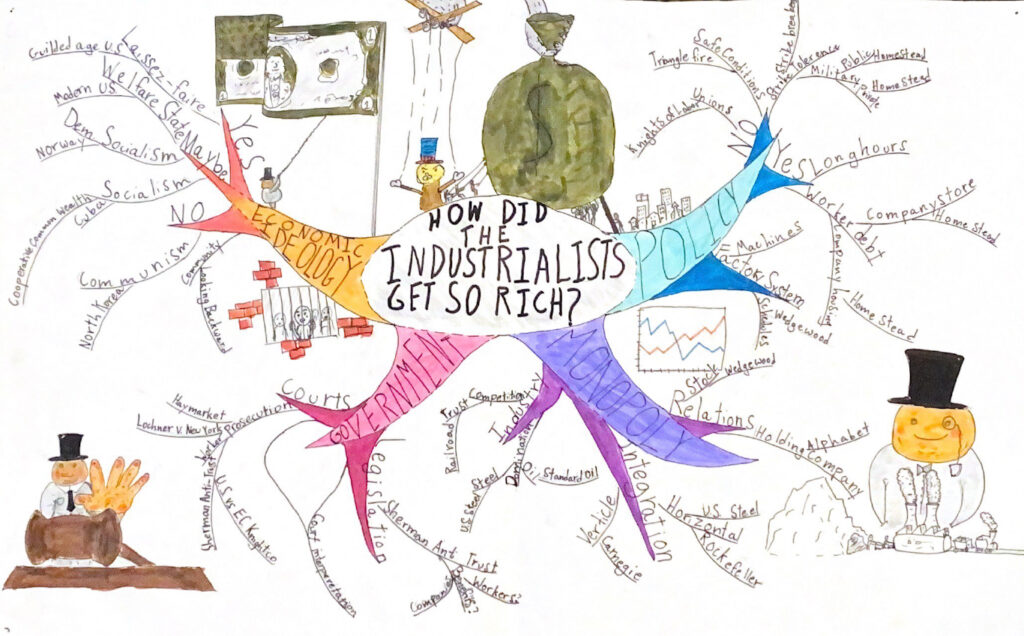
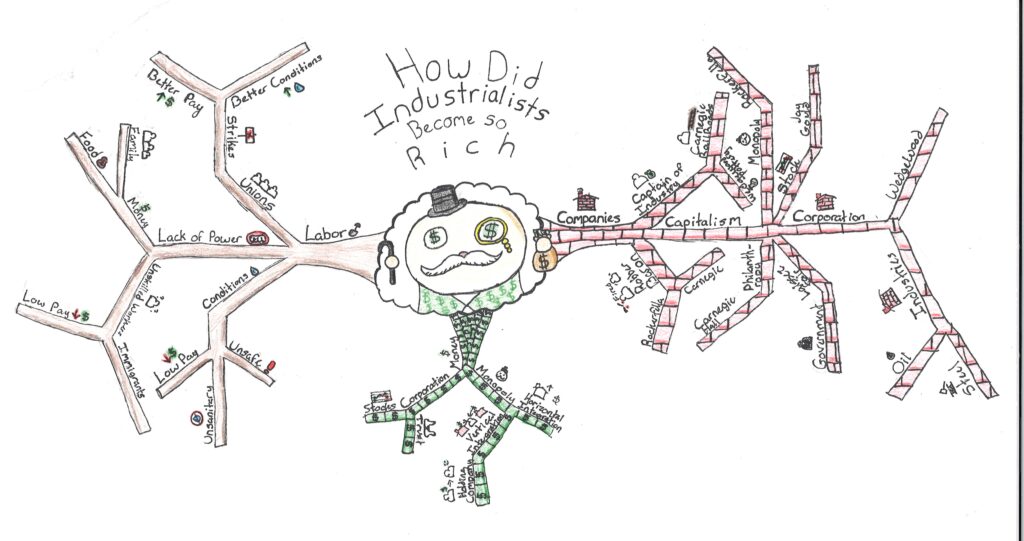
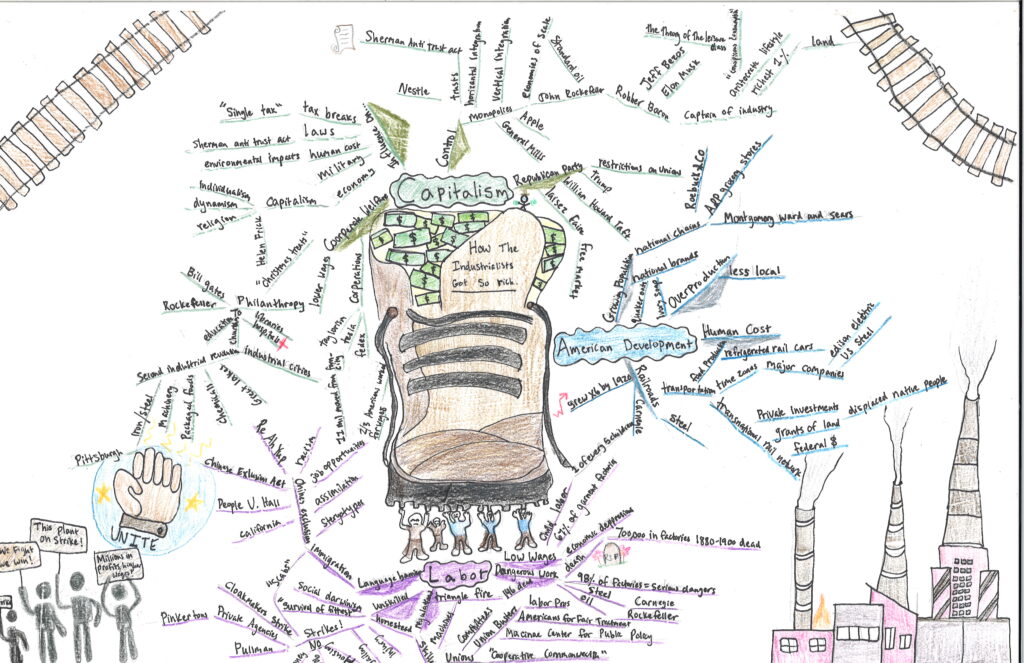
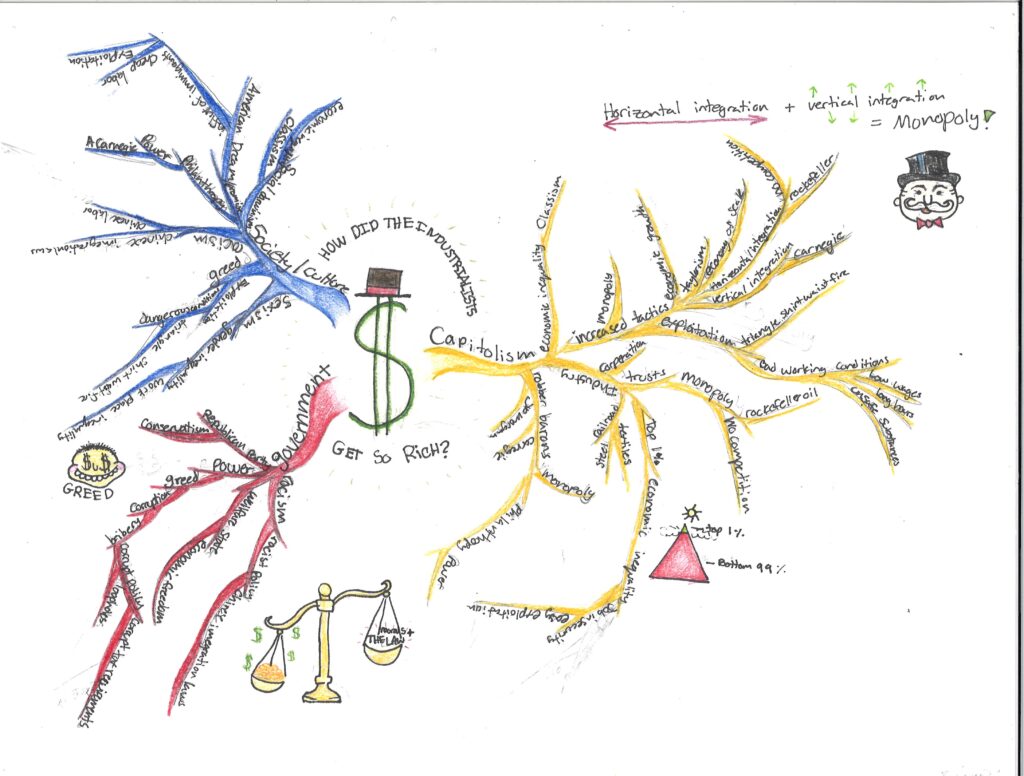
The 10th grade has been studying the era of Industrialization in the late 19th and early 20th centuries. Students chose one of these questions to answer in the form of a Mind Map:
- How did the industrialists get so rich?
- What obstacles have gotten in the way of class-based organizing in the U.S.?
- What lessons should we learn today from industrialization and labor history of the late 19th century?
A Mind Map is a way of representing complex ideas that mirrors how our brains retain information. Mind Mapping requires us to be more intentional about how we use our working memory to remember what we learn and analyze. Mind mapping, in essence, creates more neuro-pathways to a memory which can serve to stimulate recall of that memory.
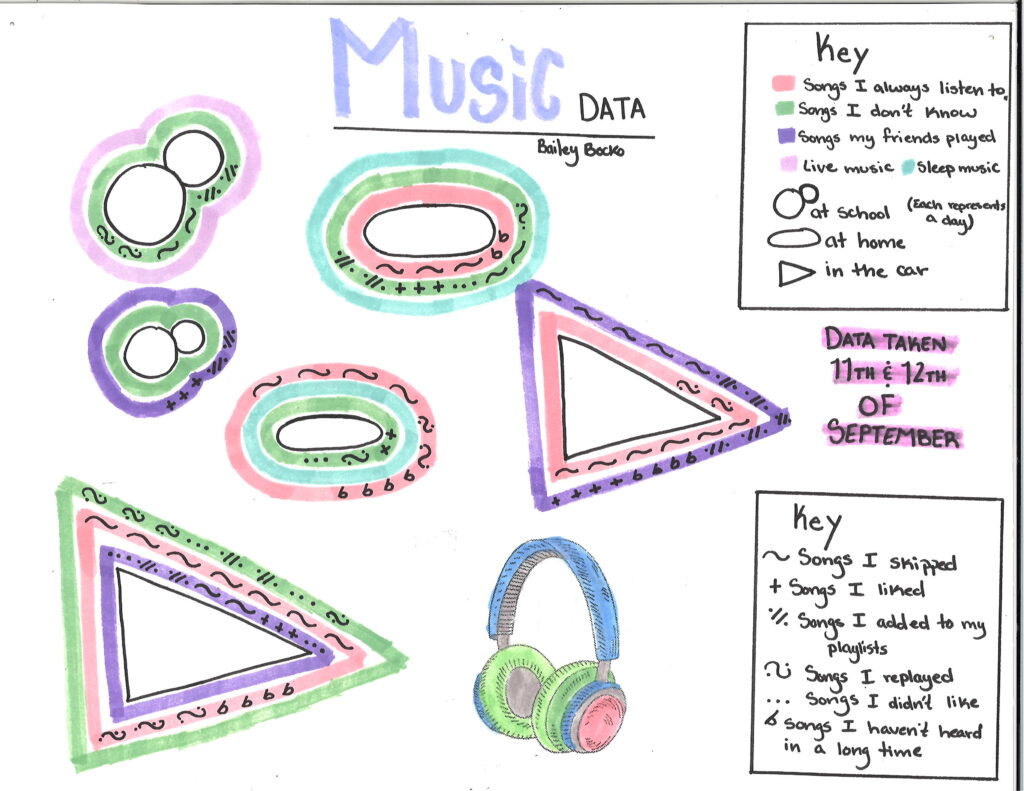
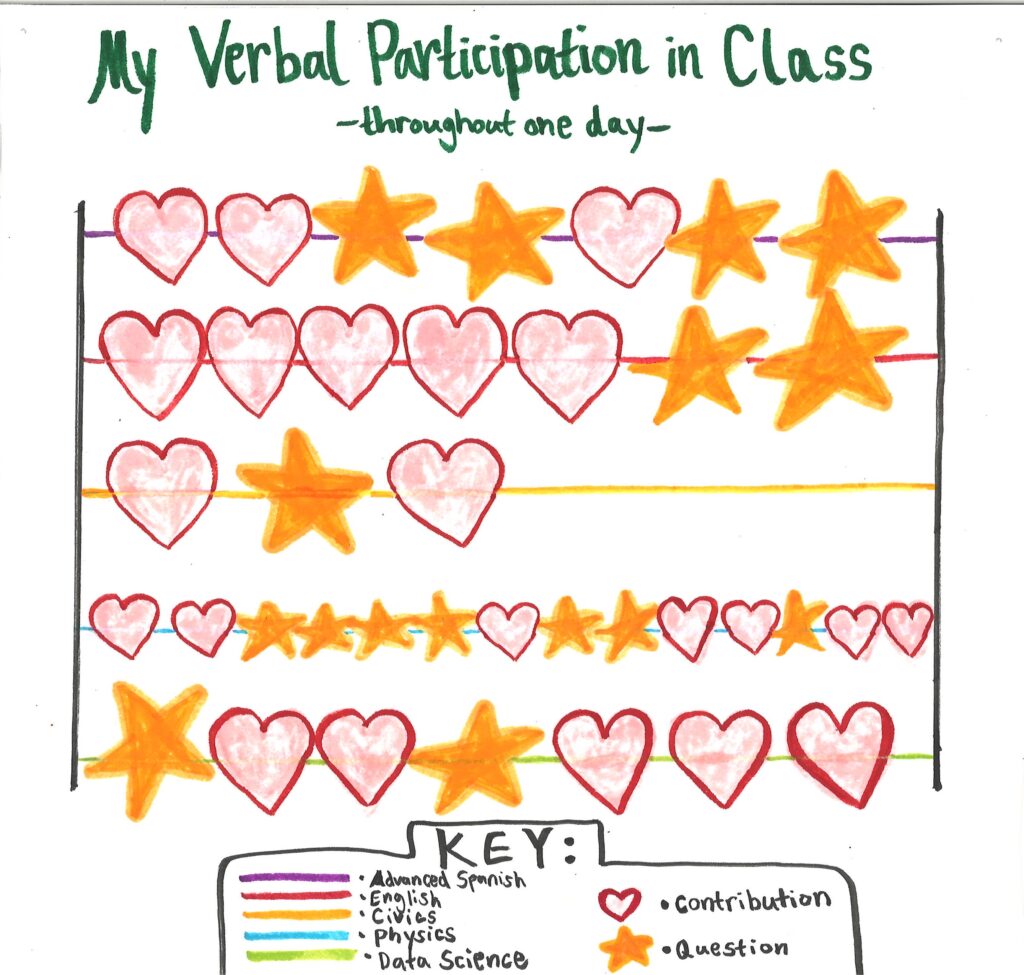
Senior Data Science Data Postcards
Students engaged in the data science process. They asked an interesting question about themselves. They gathered and organized their data. They modeled, analyzed and synthesized and communicated their results, engaging in the revision process along the way. Students’ work was inspired by Dear Data, a year-long, data drawing project by data scientists Giorgia Lupi and Stefanie Posavec.
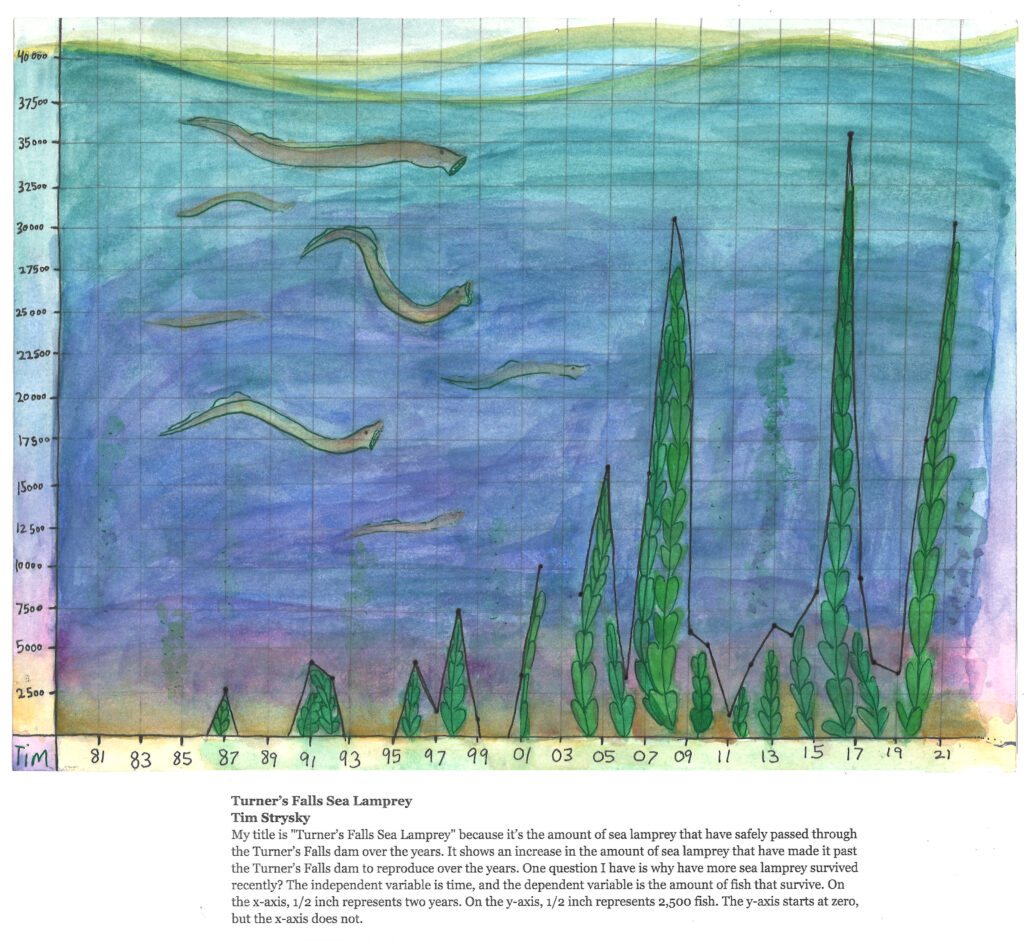
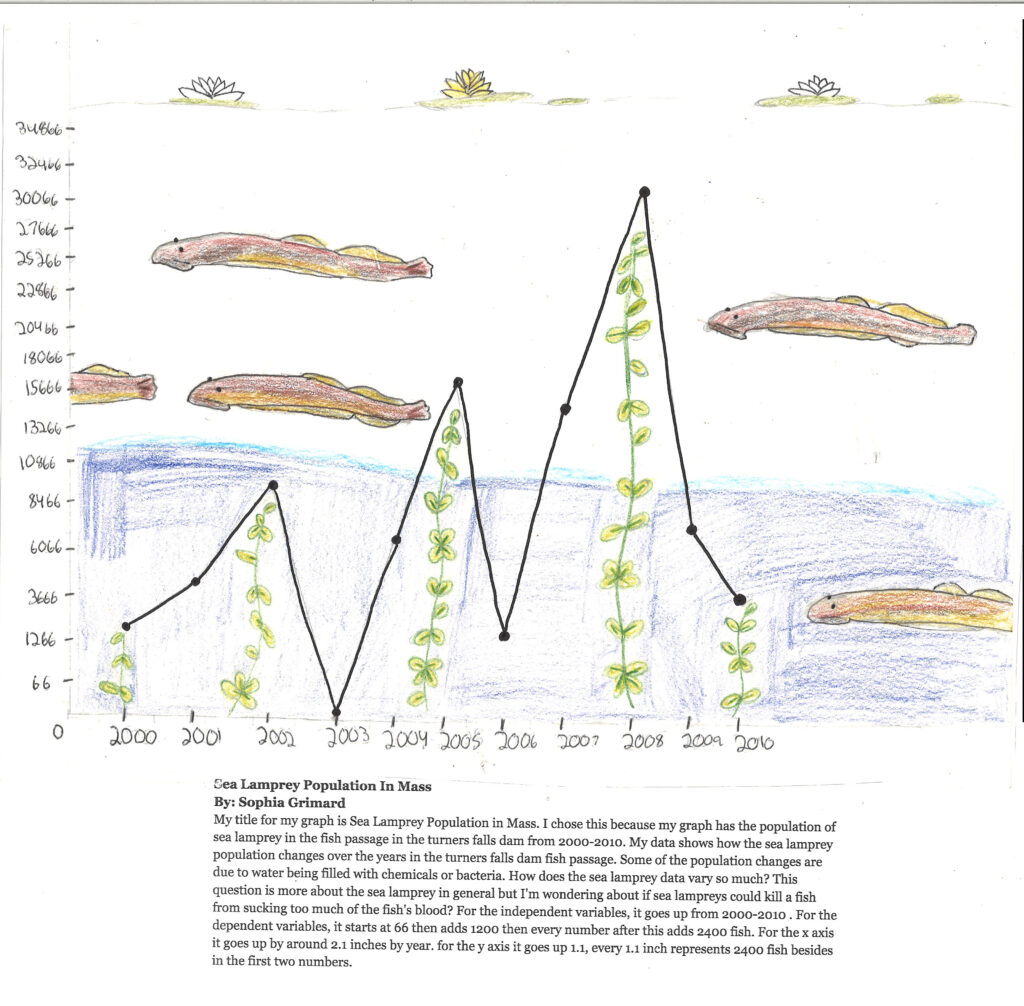
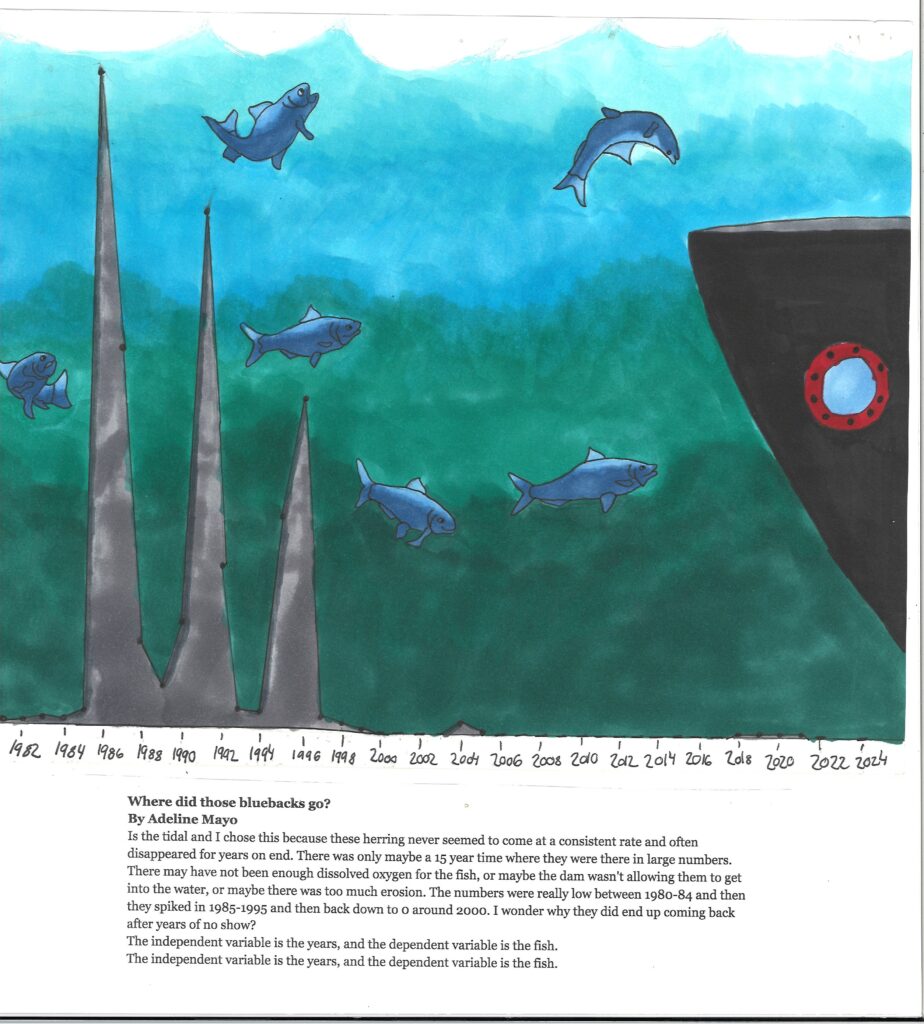
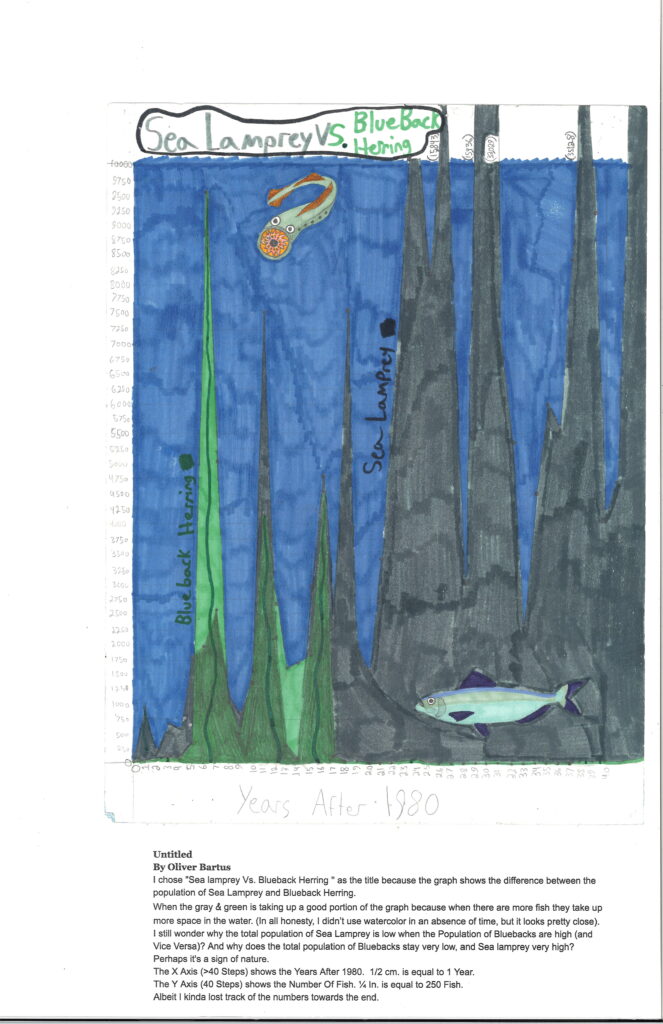
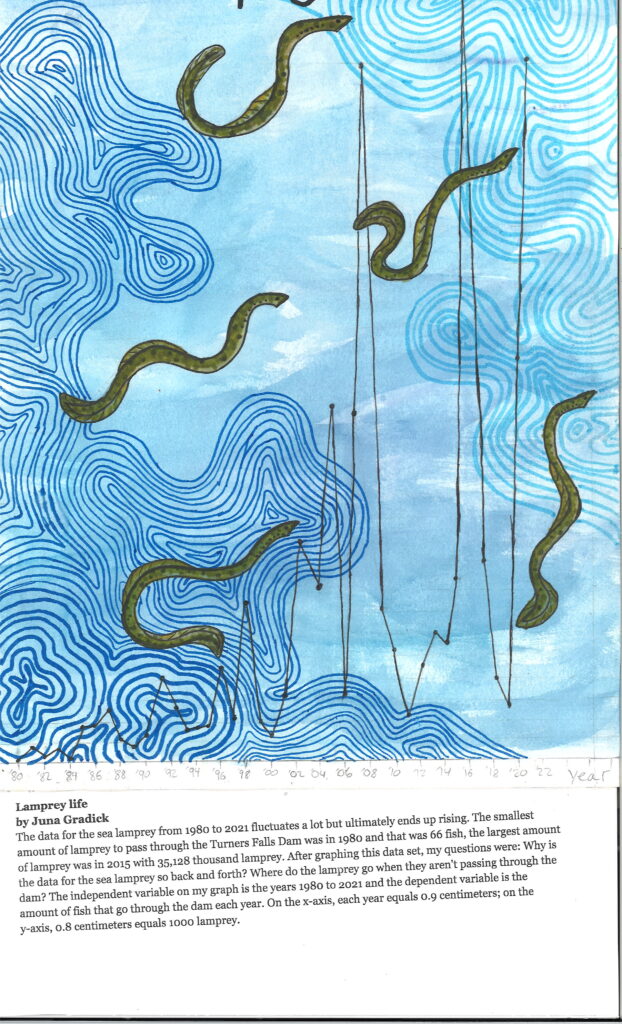
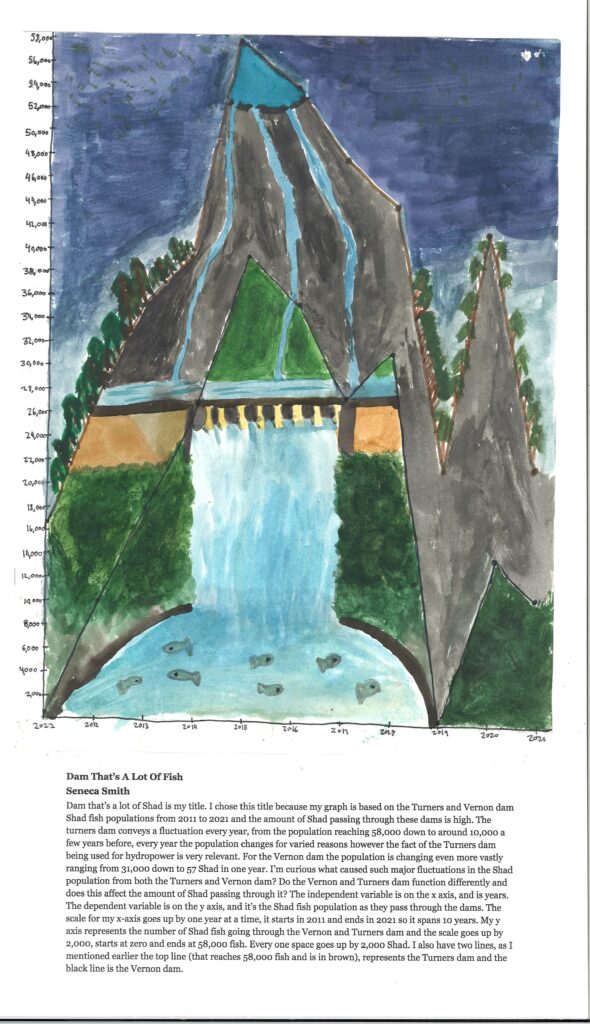
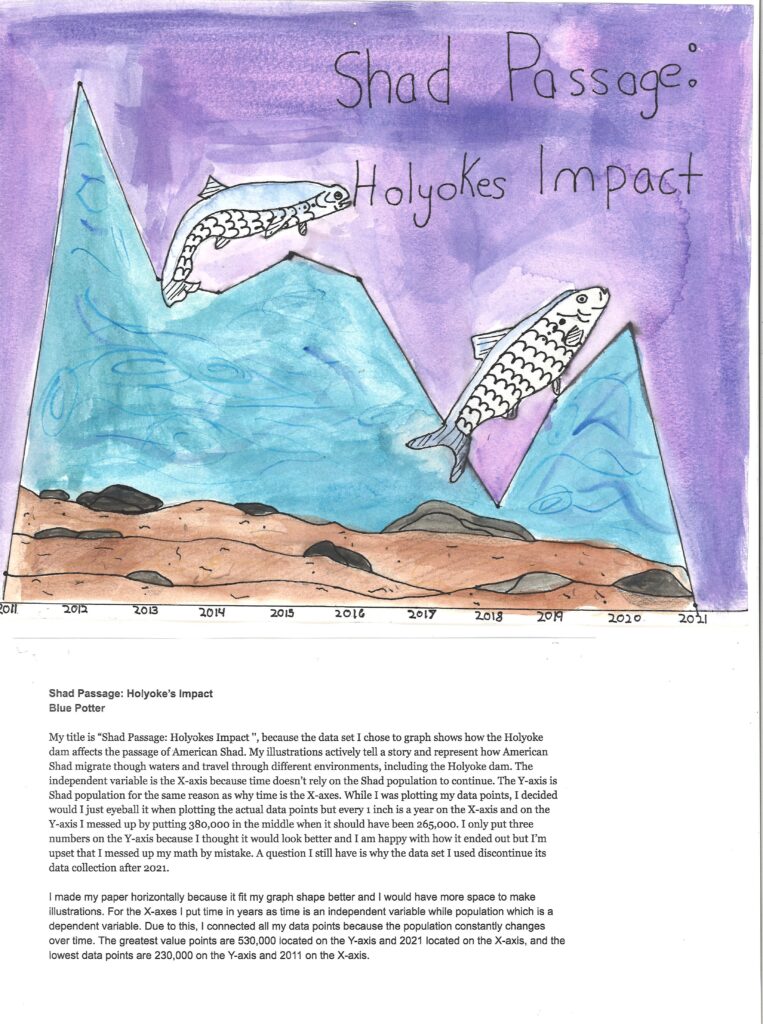
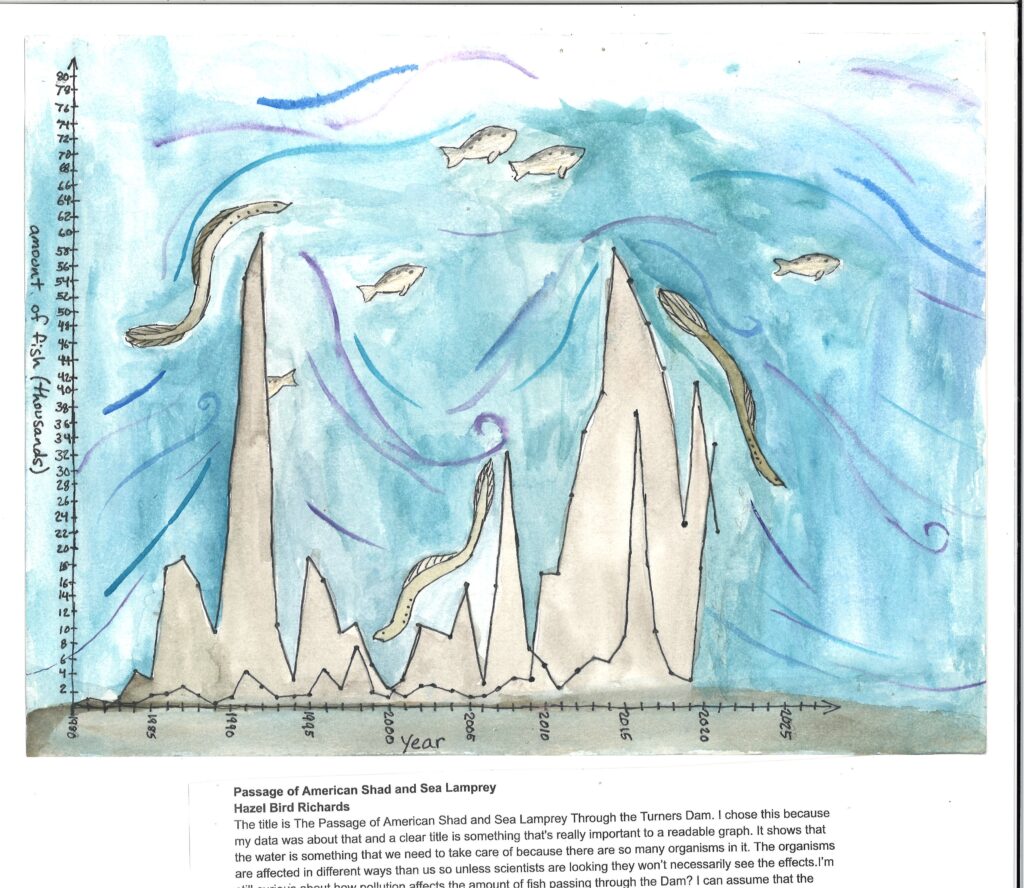
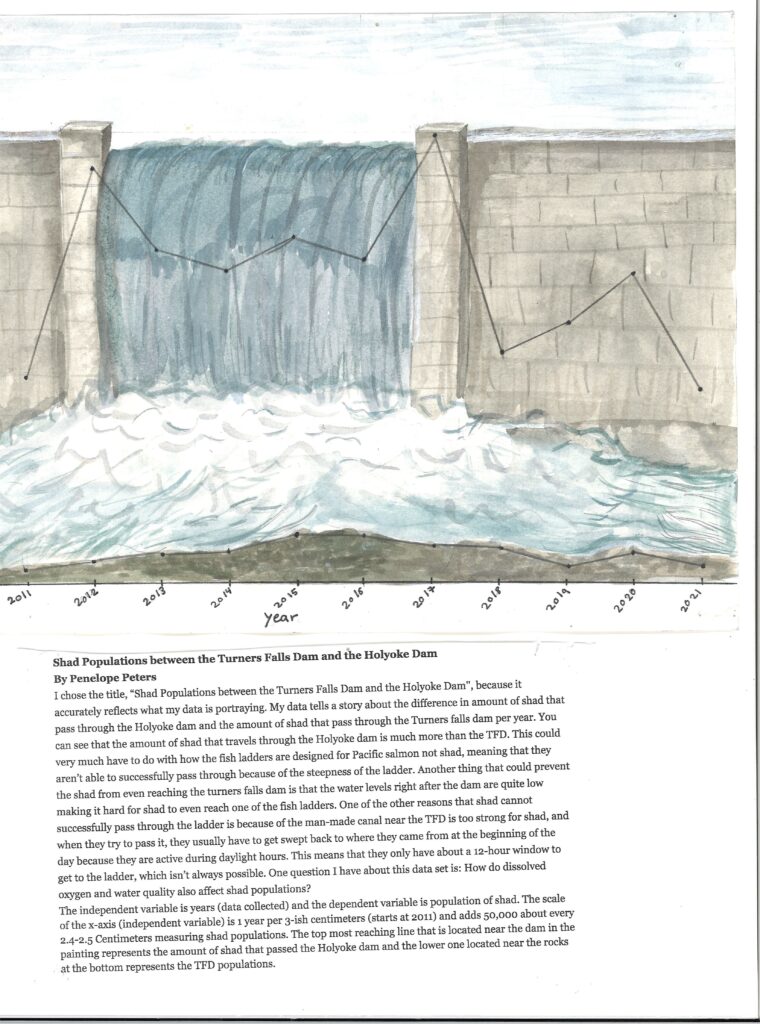
9th Grade Water Graphs
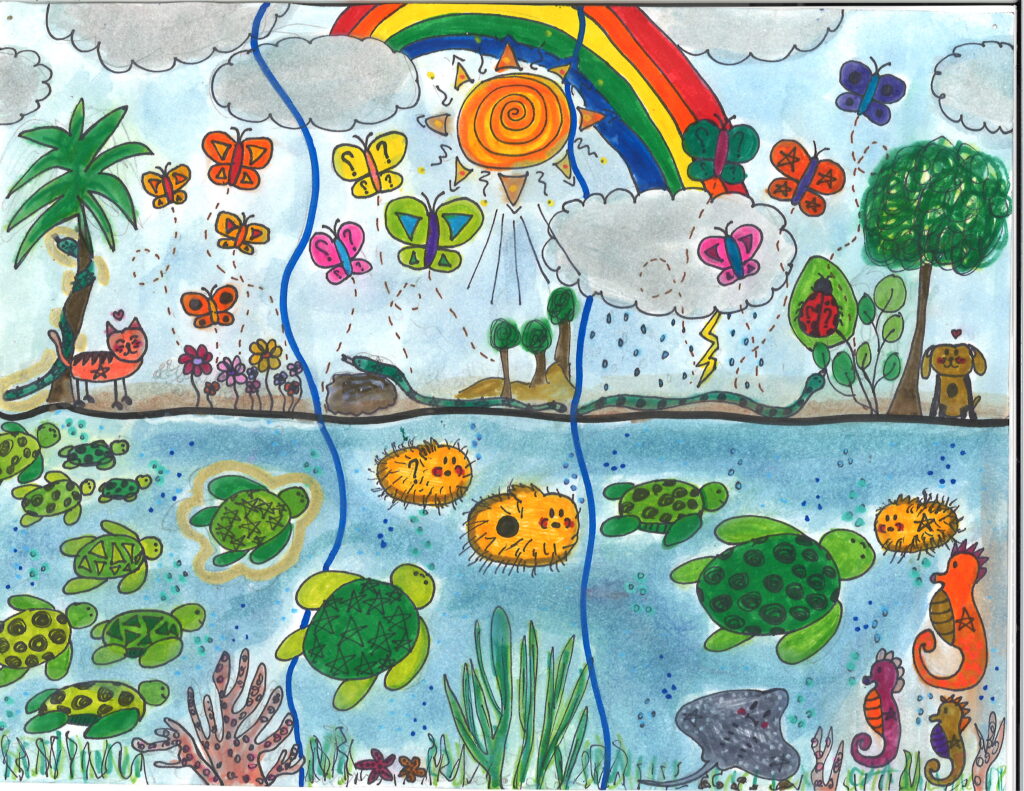
Students in 9th grade Environmental Science and Algebra create watercolor data displays in the style of Jill Pelto’s work. This interdisciplinary curriculum sharpens students’ abilities to gather, display and interpret data and statistical results to investigate relationships they observe and hypothesize.
In particular, students examine
local data sets, including fish data from the Turners Falls Dam and Shad passage data from the Connecticut River Conservancy. Students visualize their interpretations and analyses through their watercolor graphs. They explain their thinking in their artist statement.
